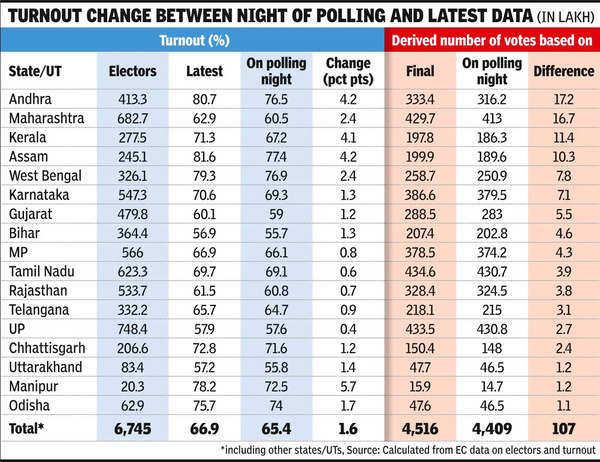
How do we reach this conclusion? The EC has been putting out data on turnout in various stages in each phase, apart from what is available ‘real-time’ on its app.The latest data put out on polling day in each phase has been for somewhere between 10.30 pm and 11.30 pm. The ‘final’ figures – which still do not include postal votes and which the EC app cautions are “approximate trends” – were put out 11 days after polling day for the first phase, and four days after polling for phase 2, 3 and 4.
The final figures have been only very slightly different from figures put out typically late evening on the day after polling. However, they vary considerably from the data put out on polling night in several states. Since the EC has also put out numbers for the electorate in each constituency – though only after the first two phases and a controversy over the lack of any absolute numbers – and since the turnout data is correct to two decimal places, it is possible to get an approximation of the votes cast by working back (see graphic).
Such calculation backward shows that the implied difference in number of votes for the two turnout figures was about 18.6 lakh for phase 1, 32.2 lakh for phase 2, 22.1 lakh for phase 3 and 33.9 lakh for phase 4, totalling up to 1.07 crore.
The biggest variations were in Andhra Pradesh, 4.2 percentage points in turnout and 17.2 lakh in derived vote numbers, Maharashtra (2.4 percentage points and 16.7 lakh), Kerala (4.1 percentage points and 11.4 lakh) and Assam (4.2 percentage points and 10.3 lakh). In Assam’s case, that translates to an average difference of over 73,000 per constituency. For Andhra Pradesh, the average is 69,000 and for Kerala 57,000. Karnataka at 51,000 and Maharashtra at 48,000 have also seen significant differences. The variation in the Hindi heartland states was on the lower side.
